Economic Indicators 2025: Key Trends, Leading Indicators & How to Use Them
Introduction
Economic indicators are vital tools that help analysts, investors, businesses, and policymakers gauge the health of an economy. By tracking these metrics, stakeholders can make informed decisions, anticipate market shifts, and adjust strategies accordingly.
In 2025, understanding economic indicators is more crucial than ever due to evolving global markets, technological advancements, and geopolitical uncertainties. This guide explores the most important U.S. economic indicators in 2025, their impact, and how to use them effectively.
What Are Economic Indicators?
Economic indicators are statistical data points that reflect the performance of an economy. They help measure growth, inflation, employment, consumer behavior, and industrial activity.
Why They Matter:
- Investors use them to predict stock and bond market movements.
- Businesses rely on them for hiring, production, and pricing decisions.
- Policymakers (like the Federal Reserve) adjust interest rates and fiscal policies based on these trends.
Without these indicators, economic forecasting would be speculative rather than data-driven.
Types of Economic Indicators
Economic indicators are classified based on their timing and relationship to the economy:
Leading Economic Indicators
Leading economic indicators are forward-looking metrics that predict economic activity 6-12 months in advance. They are invaluable for investors, businesses, and policymakers aiming to anticipate trends rather than react to them.
Key Examples & Why They Matter:
- Stock Market Performance: Rising markets suggest investor confidence in future corporate earnings, while declines may signal recession risks.
- Manufacturing Orders (Durable Goods Report): Increased orders indicate businesses expect higher demand, signaling expansion.
- Building Permits: A surge in permits foreshadows construction growth and job creation.
- Consumer Sentiment Index: Measures spending intent; high confidence correlates with stronger retail sales.
Limitations:
Leading indicators can give false signals (e.g., temporary market rallies). They work best when combined with other data.
2025 Relevance:
With AI and geopolitical shifts, traditional indicators like manufacturing data may be supplemented with real-time supply chain analytics.
Lagging Economic Indicators
Lagging economic indicators confirm trends after they occur, providing validation for economic shifts. They are critical for assessing long-term patterns.
Key Examples & Their Role:
- Unemployment Rate: Rises after economic slowdowns begin (e.g., peaked at 14.8% in April 2020, post-pandemic start).
- Corporate Profits: Reflect business health retrospectively; declines confirm recessionary pressures.
- Inflation (CPI): Tracks price changes with a delay, influencing Fed rate adjustments.
Why They Matter:
- Policymakers use lagging indicators to justify interventions (e.g., stimulus during high unemployment).
- Businesses analyze them to adjust strategies (e.g., layoffs after profit drops).
2025 Considerations:
Traditional lagging metrics like CPI may evolve with new inflation measurement tools (e.g., real-time rent price tracking).
Coincident Economic Indicators
Coincident indicators move in lockstep with the economy, offering a real-time snapshot of economic health.
Critical Examples:
- GDP Growth Rate: The broadest measure of economic activity, reported quarterly.
- Industrial Production: Tracks manufacturing output; dips signal immediate slowdowns.
- Retail Sales: Reflect consumer spending power in real time.
Applications:
- The Fed uses coincident indicators to assess current policy impacts.
- Businesses monitor them for immediate adjustments (e.g., ramping up production if sales rise).
2025 Changes:
- GDP calculations may incorporate digital economy contributions (e.g., AI services).
- Retail sales data could integrate e-commerce metrics more dynamically.
Procyclical vs. Countercyclical Indicators
These categories describe how indicators relate to economic cycles.
Procyclical Indicators
- Rise during growth, fall during downturns:
- Consumer Spending: Increases in expansions, drops in recessions.
- Corporate Investments: Peaks during booms.
Countercyclical Indicators
- Rise during downturns, fall during growth:
- Unemployment Claims: Spike in recessions.
- Bankruptcies: Increase when the economy contracts.
Why the Distinction Matters:
- Investors use procyclical indicators to time market entry/exit.
- Governments target countercyclical policies (e.g., unemployment benefits during crises).
2025 Trends:
- Procyclical: Green energy investments may surge with growth.
- Countercyclical: Crypto volatility could emerge as a new recession signal.
Leading Economic Indicators: Predicting Trends in 2025
Leading indicators are critical for forecasting economic shifts. Here are the top leading economic indicators to watch in 2025:
1. Stock Market Performance
A strong stock market reflects investor optimism about future corporate earnings and economic growth. When major indices like the S&P 500 rise steadily, it signals confidence in business conditions. Conversely, prolonged declines—especially across sectors—often precede recessions, as seen before the 2008 financial crisis.
2. Manufacturing Orders (Durable Goods Report)
The Durable Goods Report tracks big-ticket purchases by businesses, such as machinery and equipment. Rising orders suggest companies are expanding production, anticipating higher demand. A sustained drop, however, may indicate slowing economic activity.
3. Housing Market Trends
Building permits and home sales are reliable forward-looking indicators. Increased permits signal construction growth and job creation, while strong home sales reflect consumer confidence and access to credit. A slump in housing often foreshadows broader economic weakness.
4. Consumer Sentiment Index
This survey (e.g., University of Michigan) gauges household spending intentions. High sentiment correlates with robust retail sales, while pessimism can lead to reduced spending and slower GDP growth.
5. Interest Rate Movements
The Federal Reserve adjusts rates to control inflation and growth. Rate hikes curb borrowing and spending, cooling inflation. Cuts lower loan costs, stimulating business investment and consumer spending.
6. Jobless Claims
Weekly unemployment filings provide early warnings of labor market shifts. Rising claims suggest layoffs and economic stress, while declines point to stability.
Why It Matters: These indicators help predict recessions, guide investments, and inform policy decisions. Tracking them allows proactive adjustments to financial strategies.
Key U.S. Economic Indicators in 2025
Here are the most critical U.S. economic indicators in 2025, their recent trends, and forecasts:
| Indicator | What It Measures | 2025 Outlook |
|---|---|---|
| GDP Growth Rate | Economic expansion/contraction | Moderate growth (~2-2.5%) |
| Unemployment Rate | Labor market health | Expected near 4% |
| Inflation (CPI & PPI) | Price stability | Likely stabilizing at ~2.5% |
| Federal Reserve Rates | Monetary policy | Possible rate cuts if inflation cools |
| Consumer Confidence Index | Spending power | Stable if wages rise |
| S&P 500 Trends | Market performance | Tech & green energy sectors leading |
Key Insights:
- Inflation remains a concern, but the Fed aims for a “soft landing.”
- AI and automation may impact job market data.
- Green energy investments could boost GDP growth.
Economic Indicator Examples and Their Impact
A. Stock Market Reactions
- A strong jobs report → Stocks rise (confidence in spending).
- High inflation → Market volatility (rate hike fears).
B. Business Decisions
- Rising PPI (Producer Price Index) → Companies raise prices.
- Falling retail sales → Businesses cut production.
C. Government Policies
- High unemployment → Stimulus packages.
- Rising CPI → Fed raises interest rates.
D. Everyday Consumers
- Wage growth vs. inflation determines real income.
- Mortgage rates impact homebuying affordability.
The Role of Government Policies in Shaping Economic Indicators
Government actions directly influence key economic indicators, creating ripple effects across markets.
A. Fiscal Policies (Taxation & Spending)
- Expansionary policies (increased spending/tax cuts) → Boost GDP growth but may raise inflation.
- Austerity measures → Slow growth but stabilize debt (e.g., 2025 deficit reduction debates).
B. Federal Reserve’s Monetary Policy
- Interest rate adjustments control inflation and borrowing costs.
- Quantitative tightening in 2025 could cool overheated sectors like housing.
C. Recent U.S. Policies Affecting 2025
- Inflation Reduction Act impacts on clean energy jobs and manufacturing.
- Supply chain resilience policies altering trade deficit metrics.
The Impact of Technology and AI on Economic Indicators
Technological disruption is rewriting traditional economic models.
A. Automation & Labor Market Shifts
- AI-driven productivity gains may artificially boost GDP while suppressing wage growth.
- BLS unemployment metrics now track gig economy workers more closely.
B. Digital Currencies & Fintech
- CBDCs (Central Bank Digital Currencies) could reshape money supply tracking (M2).
- Crypto volatility forcing new asset class indicators.
C. AI-Powered Forecasting
- Machine learning models predict recessions using alternative data (e.g., satellite warehouse imagery).
- Real-time inflation tracking via web scraping price data.
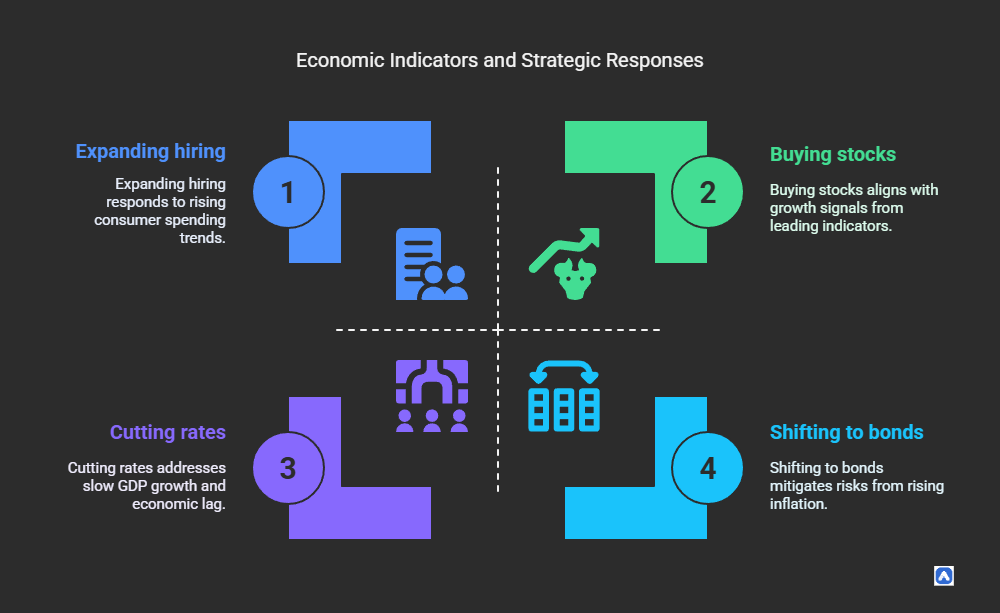
How to Use Economic Indicators for Decision-Making
For Investors:
- Buy stocks when leading indicators suggest growth.
- Shift to bonds if lagging indicators (inflation) rise.
For Businesses:
- Expand hiring if consumer spending rises.
- Adjust pricing based on PPI trends.
For Policymakers:
- Cut rates if GDP growth slows.
- Stimulate jobs if unemployment rises.
Where to Track Economic Indicators in Real Time
Best Sources for 2025 Data:
- Federal Reserve Economic Data (FRED)
- Bureau of Labor Statistics (BLS)
- U.S. Bureau of Economic Analysis (BEA)
- Trading Economics
- Bloomberg / Reuters Economic Calendars
Tools:
- Investing.com Economic Calendar
- Yahoo Finance Market Trends
Conclusion
As we move into 2025, the role of economic indicators will continue to be a cornerstone for navigating the complexities of financial markets, business strategies, and government policies. These metrics are not just numbers on a page—they represent the pulse of the economy, offering critical insights into its health and trajectory. By understanding and leveraging leading , lagging , and coincident indicators , businesses, investors, and policymakers can anticipate risks, seize opportunities, and make informed decisions that drive sustainable growth.
The Enduring Importance of Economic Indicators
Economic indicators serve as a bridge between data and decision-making, providing a clear lens through which stakeholders can view the economic landscape. In an era marked by rapid technological advancements, shifting geopolitical dynamics, and evolving consumer behaviors, these metrics are more vital than ever. For example, leading indicators such as stock market performance, manufacturing orders, and housing starts offer glimpses into future economic activity, enabling proactive responses to potential challenges or opportunities. Similarly, lagging indicators like unemployment rates and inflation confirm trends after they occur, allowing for retrospective analysis and policy adjustments. Meanwhile, coincident indicators —such as industrial production and retail sales—provide real-time snapshots of economic conditions, ensuring that decisions are grounded in current realities.
In 2025, these indicators will play a particularly crucial role in shaping discussions around key economic themes. Issues like inflation, Federal Reserve interest rates, and labor market dynamics will dominate headlines, influencing everything from household budgets to corporate investment strategies. By staying attuned to these metrics, stakeholders can position themselves to thrive in an increasingly interconnected and dynamic economic environment.
Key Takeaways for Navigating 2025
To fully harness the power of economic indicators , it’s essential to focus on their specific roles and implications. Here are some key takeaways to guide decision-making in 2025:
- Leading Indicators Predict Future Trends
Leading indicators are the crystal balls of the economic world, offering early warnings of shifts in economic activity. Metrics such as stock market performance, consumer sentiment indices, and jobless claims provide valuable signals about where the economy is headed. For instance, a sustained rise in the stock market often reflects investor optimism about future earnings, while a spike in initial jobless claims may signal impending layoffs and economic contraction. By monitoring these indicators, businesses can adjust production schedules, investors can reallocate portfolios, and policymakers can implement preemptive measures to stabilize growth. - Inflation and Fed Rates Will Dominate Discussions
Few topics will command as much attention in 2025 as inflation and Federal Reserve interest rates. Inflation, measured by the Consumer Price Index (CPI) and Producer Price Index (PPI), directly impacts consumer purchasing power and business costs. Persistent inflationary pressures could lead to higher interest rates, increasing borrowing costs and potentially slowing economic growth. Conversely, a decline in inflation might prompt the Federal Reserve to lower rates, stimulating spending and investment. Businesses must factor these dynamics into their pricing and expansion strategies, while investors should consider how rate changes might affect asset prices and returns. - Real-Time Tracking Empowers Proactive Decision-Making
In today’s fast-paced world, access to real-time data is a game-changer. Tools like economic calendars, dashboards from platforms such as FRED (Federal Reserve Economic Data), and updates from government agencies like the Bureau of Labor Statistics (BLS) enable stakeholders to stay ahead of the curve. Real-time tracking allows businesses to respond quickly to changing consumer demand, investors to capitalize on emerging market trends, and policymakers to craft timely interventions. For example, a sudden drop in retail sales reported in real time might prompt a retailer to launch promotional campaigns or adjust inventory levels immediately.
Why Economic Indicators Matter Across Sectors
The impact of economic indicators extends far beyond financial markets, influencing every aspect of the economy. For businesses, these metrics inform critical decisions about hiring, production, and pricing. A rise in consumer confidence, for instance, might encourage companies to expand their workforce or invest in new product lines. On the other hand, declining manufacturing orders could signal the need to scale back operations or renegotiate supplier contracts.
Investors rely on economic indicators to identify opportunities and mitigate risks. For example, a strong GDP growth rate coupled with low unemployment might signal a favorable environment for equities, while rising inflation could prompt a shift toward inflation-resistant assets like commodities or Treasury Inflation-Protected Securities (TIPS). Policymakers, meanwhile, use these indicators to design fiscal and monetary policies that promote stability and growth. Whether it’s implementing tax cuts to stimulate spending or raising interest rates to curb inflation, economic indicators provide the foundation for effective governance.
Even everyday consumers benefit from understanding these metrics. For instance, tracking inflation rates helps households anticipate changes in the cost of living, while monitoring unemployment trends can guide career decisions. By staying informed, individuals can make smarter choices about saving, spending, and investing, ensuring financial security in an uncertain world.
FAQs
What exactly are economic indicators?
Economic indicators are statistical data points that measure the health of an economy. They include metrics like GDP, unemployment rates, inflation (CPI), and stock market performance.
Why should I care about economic indicators in 2025?
In 2025, with rapid technological changes, geopolitical tensions, and AI-driven markets, these indicators help:
- Investors predict stock and bond trends.
- Businesses decide on hiring, pricing, and expansion.
- Policymakers set interest rates and fiscal policies.
What’s the difference between leading, lagging, and coincident indicators?
- Leading indicators (e.g., stock market, manufacturing orders) predict future trends.
- Lagging indicators (e.g., unemployment rate, CPI) confirm past trends.
- Coincident indicators (e.g., GDP, retail sales) show real-time economic health.
What are procyclical and countercyclical indicators?
What key U.S. indicators should I watch in 2025?
The top five are:
- GDP Growth Rate – Measures economic expansion or recession.
- Unemployment Rate – Indicates labor market strength.
- Inflation (CPI & PPI) – Tracks rising prices and Fed responses.
- Federal Reserve Interest Rates – Affects loans, mortgages, and investments.
- Consumer Confidence Index – Predicts spending behavior.
How will AI impact these indicators?
AI is improving real-time data tracking (e.g., predictive job market analytics) and may alter how traditional indicators like GDP are calculated.
How do inflation reports affect my portfolio?
High CPI → Bonds lose value, stocks may dip (especially tech). Low CPI → Fed may cut rates, boosting markets.
How are digital currencies affecting economic metrics?
Cryptocurrencies and CBDCs (Central Bank Digital Currencies) may require new ways to track money supply (M2).
How does the Federal Reserve influence economic data?
The Fed adjusts interest rates to control inflation—hikes slow spending, cuts stimulate growth.
What recent U.S. policies will impact 2025’s economy?
Policies like the Inflation Reduction Act (clean energy investments) and supply chain reforms will shape GDP and job growth.
Stay informed with AxcessRent—use data-driven strategies to thrive in 2025’s evolving economy!